
My primary objective is to explore various debugging options available for a UI5 application that can make a developer more productive in terms of detecting and fixing bad practices, memory leaks, Fiori design flaws, etc.
I have been working on OpenUI5 applications for quite some time, apart from other Js frameworks like Angular, React, Ember, etc. Debugging applications is just a natural & basic activity and something that I work on a day-to-day basis. I rely on Chrome dev tools to work and get more efficiency. This time, I choose to pen down my thoughts on debugging tools, especially on the UI5 application, as UI5 provides many more tools that are out of the box. Writing about debugging UI5 applications and not talking about the UI5 features and capabilities seems unfair to me. But you can check openui5.org for more details. Also, my colleague M. Iyer has covered this in his UI5 blog.
Unit testing has always been my first line of defense in checking the component’s desired behavior. Writing appropriate sets of unit test cases for UI5 helps you in detecting the breaking changes in the product life cycle phase. UI5 recommends using the QUnit testing framework, as it provides ample support for asynchronous testing.
Writing unit test cases for any application is not a debatable topic. However, I have seen product managers debating over writing unit test cases, especially on spending huge resource hours despite having a dedicated automation test engineering team. The decision is purely circumstantial. UI5 provides a dedicated integration testing framework, called OPA5 - One Page Acceptance Tests. OPA5 hides asynchronicity and eases access to OpenUI5 elements. This makes OPA very helpful for testing user interactions, integration with OpenUI5, navigation, and data binding. The OPA5 library is purely a JavaScript-based testing framework. There is no better feeling than getting an automation test report which shows you a detailed - passed, failed summary of code in a code coverage report. So, consider OPA5 as your second line of defense, capable of handling all of the above in one setup.
Some developers do not buy into unit testing to figure out the problem areas moreover, it doesn’t highlight other risk areas like performance, accessibility, code compliance, etc. UI5 provides multi-dimensional tools for developers to debug deeper, analyze, locate and fix errors. Let us start with a handy tool i.e. UI5 browser extension.
As a UI developer, we are mostly already are familiar with Angular, React, Vue, Lighthouse extensions. UI5 becomes another member of that list.
UI5 Chrome extension:
UI5 provides a chrome browser extension, available on Chrome Webstore. Download and install the extension. Open Chrome’s developer console and see a new tab got added as ‘UI5.’ It can auto detect a UI5 application and generates all of its metadata. If you open it for non UI5 application, it says, ‘There is no OpenUI5/SAPUI5 found on this page’ and provides a link to openui5.org for more details.

This extension provides two sets of data in two tabs i.e. in Application Information and Control Inspector.
- Application Information Tab:
It reads the application’s descriptor i.e. manifest.json and displays all of its properties in this tab. It also provides extra information on user agents and modules that are already loaded into the application. Developers won’t have to leave the browser to see the manifest file content. It also provides the last build info and the UI5 version used in the last build.
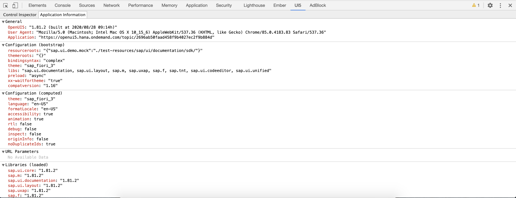
- Control inspector Tab:
This tab is of much interest to a developer. It has multiple views filtered by checkbox options to show/hide component namespaces and attributes inside components.
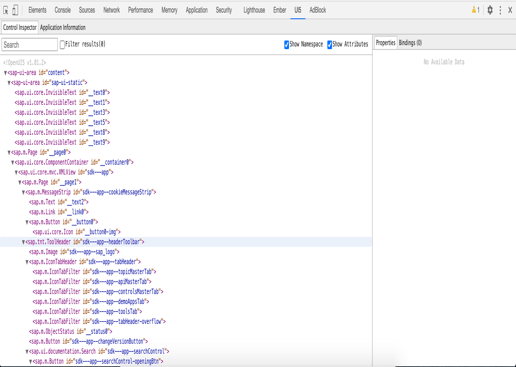
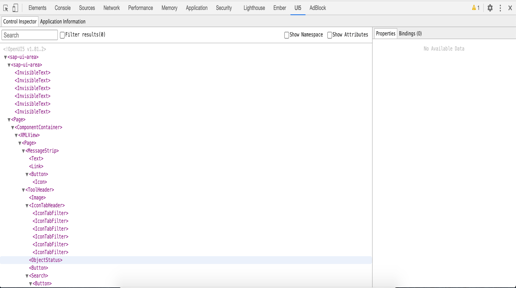
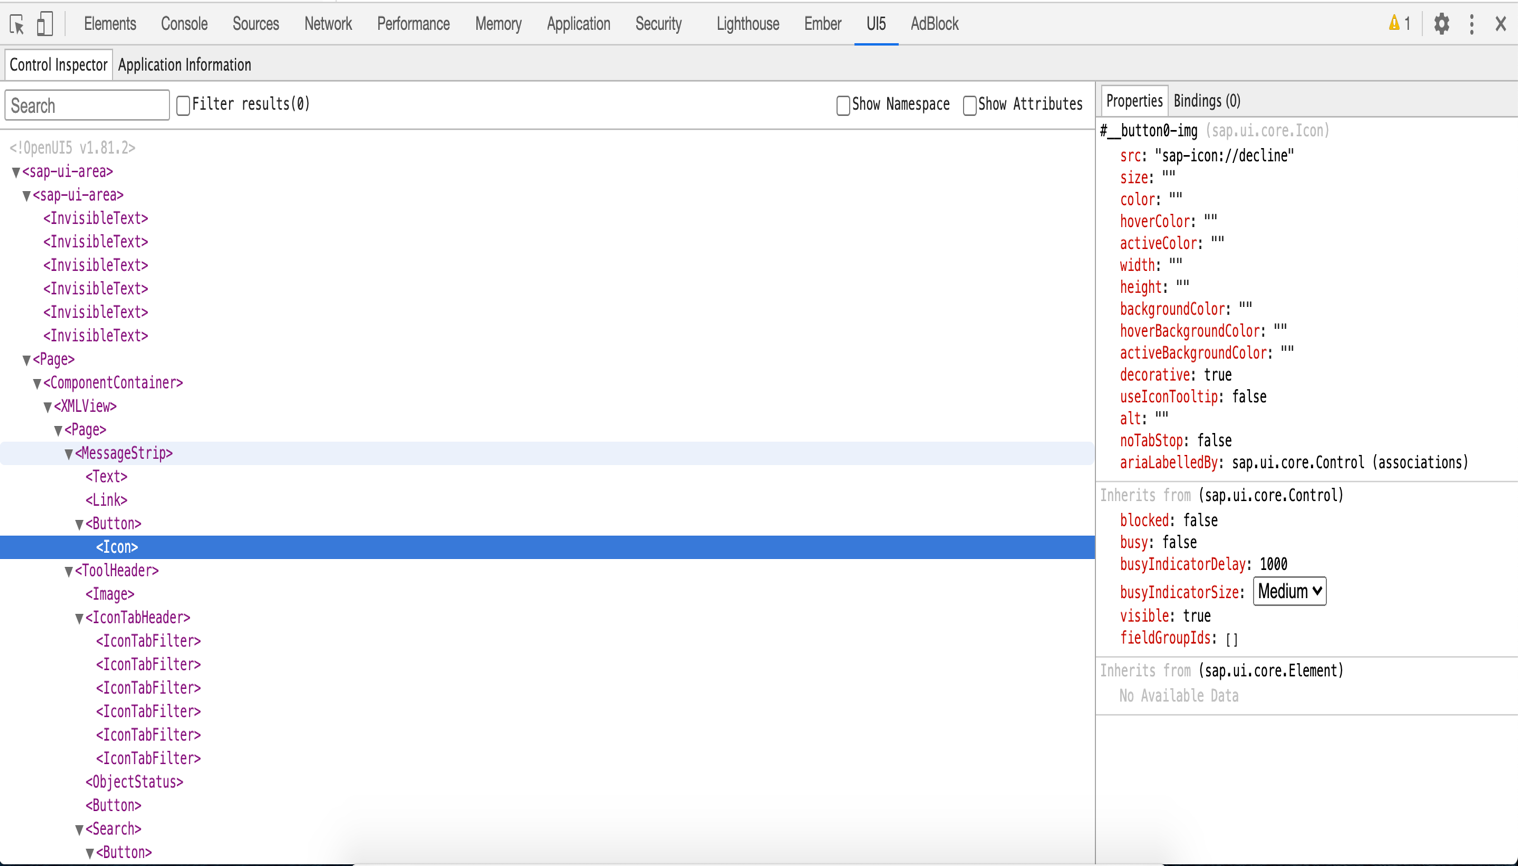
Click on any element (component tag) on the left side panel, on the right side, the properties panel shows up with all its associated properties, bindings, events registered, etc. Changing a value on the Properties panel, updates the element live on screen.
UI5 Support Assistant:
UI5 provides another exciting debugging tool centered towards figuring out performance-related issues and accessibility issues, called Support Assistant. Open the Technical Information Dialog by using the following shortcut: CTRL+SHIFT+ ALT+ P (on Windows and Linux) or CTRL+SHIFT+OPTION+P (on <MacOS). The tool aims to reduce maintenance and consulting times and to streamline OpenUI5 app development. It uses a set of predefined rules which check all the aspects of an application, for example, accessibility, performance, data binding, usability. With a simple click, you can check the current state of your app. After execution, you can analyze the results and apply the right measures depending on the outcome.
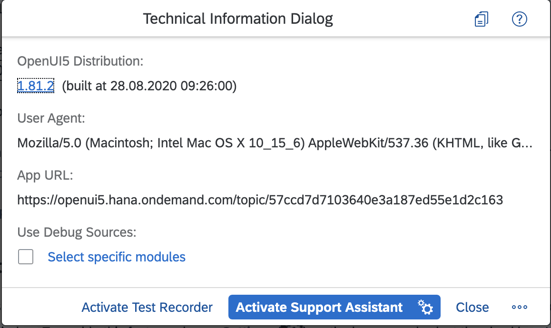
It tells you the last build timestamp and UI5 version used. Developers can click on either Activate Test Recorder or Activate Support Assistant.
Click on Diagnostics from the triple dot menu on the bottom-right corner and you will be presented with a whole lot of information.
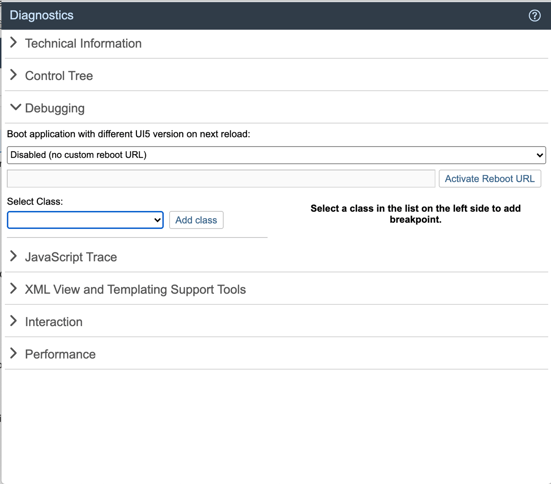
Use these menu options as per your need. Each menu option provides a different set of insights into the application code. Don’t forget to check the Performance section at the end.
All of these above discussed, out of the box UI5 tools do not hinder you from using Chrome’s debugging tools and techniques. UI5 tools are meant to help you make a further, deeper dig into the application beyond Chrome’s debugging tools. I have been using Chrome dev tools for so long and now UI5 tools are making my life much easier to debug faster, deeper and better.
Thanks for reading.


