Being a developer, one must learn how to write efficient code and debug it swiftly. Excellent debugging skills add value to an individual and to the team to find and help fix bugs faster. Every browser vendor is making a sincere effort in enhancing the developer console tool to make it accessible and useful to developers. New capabilities for Chrome's developer console tools are getting pushed in with almost every release. Making DevTools a companion for all sorts of debugging, performance management and application security is a must. This blog tries to compile some of the useful debugging patterns.
Console API
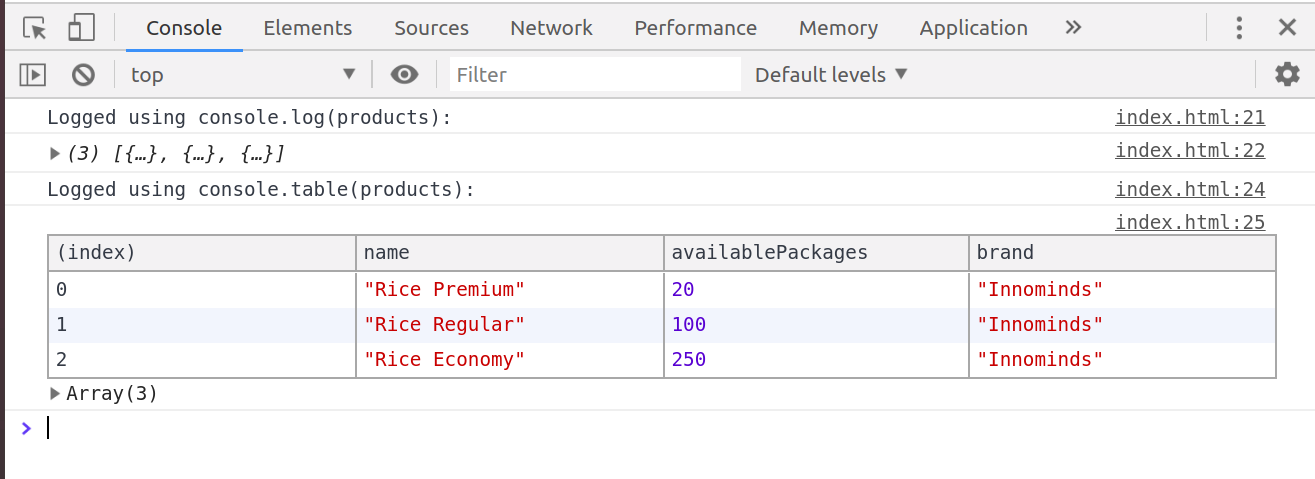
Both debugger & console API have been reliable companion to web developers for years. These are time tested methods often used by novice as well as expert developers. However, there are other flavors of console.log, which reduce the complexity of working with array and nested objects. “console.dir & console.table” are useful for logging objects & arrays respectively.
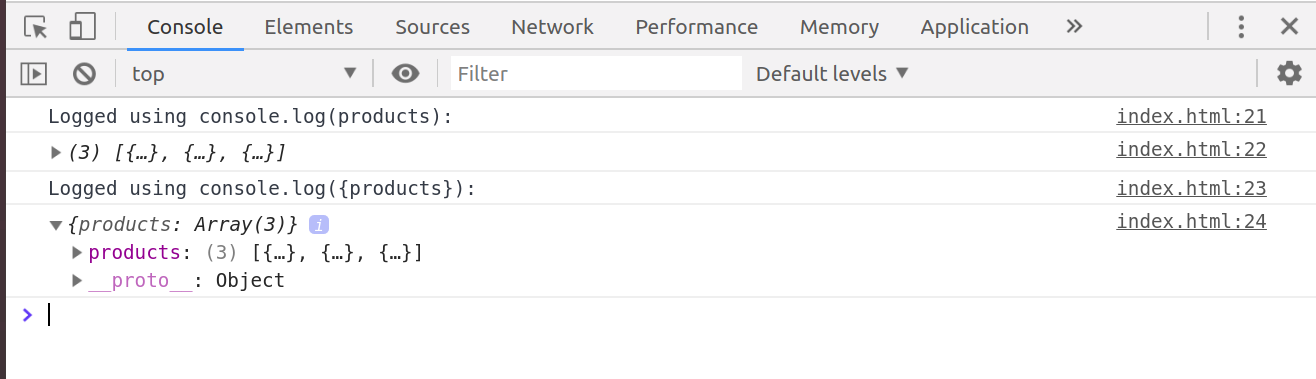
A better way to log object is by surrounding the variable names with {}. It prints the name of the variable along with its value.
Example
Var obj = {name: ‘Test’};
For better representation use console.log({obj});
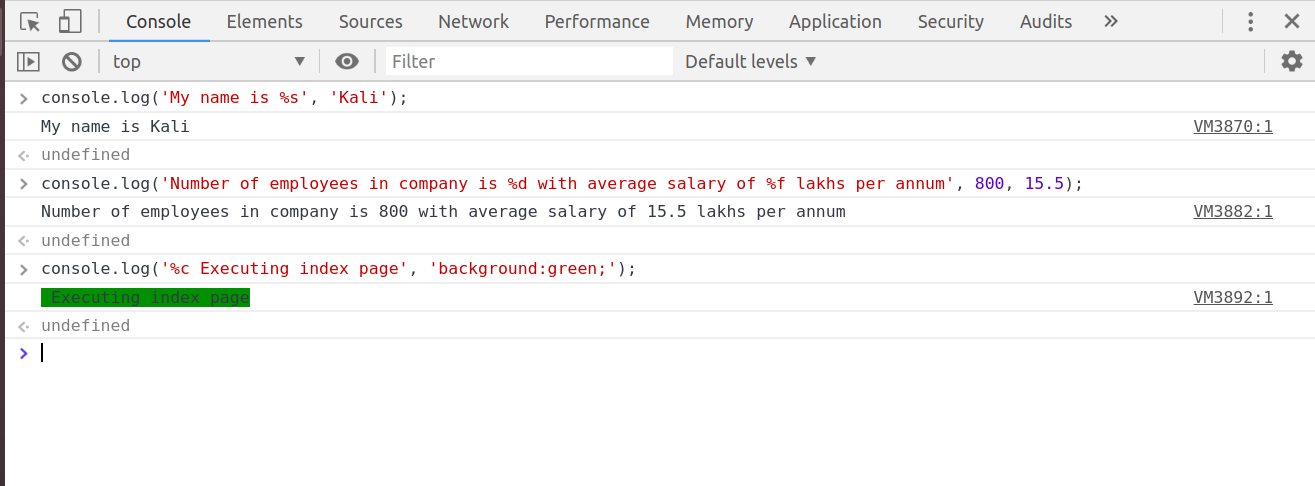
Content of console logging can be formatted to suit a variety of data types with content-substitution techniques. Console API has formatting specifiers to allow content formatting and they are shown below.
- %s: Replaces an element with a string
- Example: console.log (‘My name is %s’, ‘Kali’) // My name is Kali
- %(i | f): Replaces an element with an integer or float
- Example: console.log (‘Number of employees is company is %I with average salary %f lakhs per annum’, 800, 15.5); // Number of employees in company is 800 with average salary of 15.5 lakhs per annum
- %(o|O): Element is displayed as an object
- %c: Applies the provided CSS
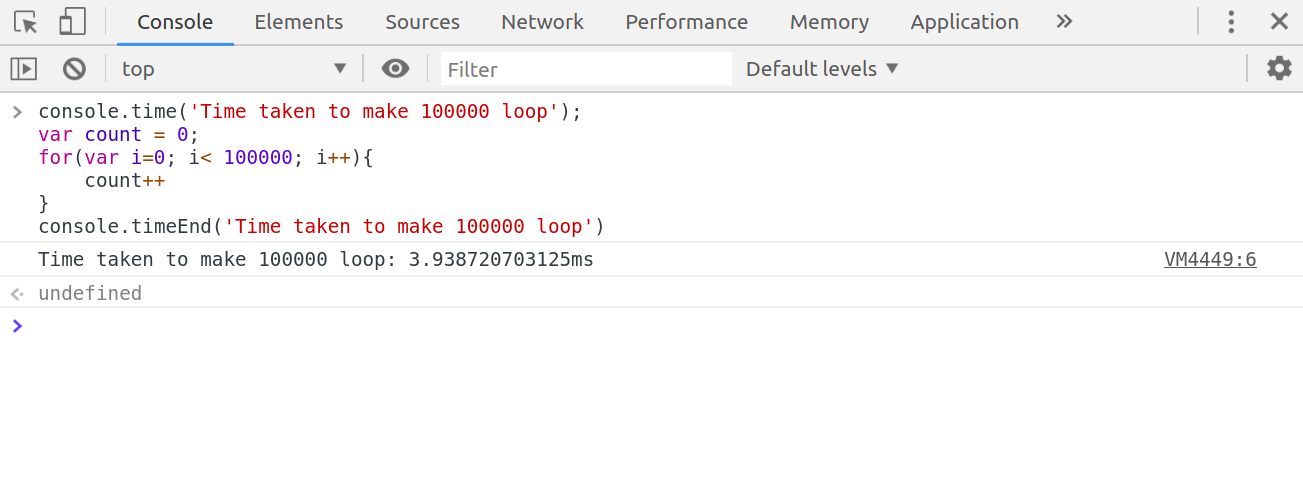
Console API helps to log time taken by a method to complete its execution. Developers use this API to get firsthand information on time taken by various function calls.
Easy to Use CSS Selectors
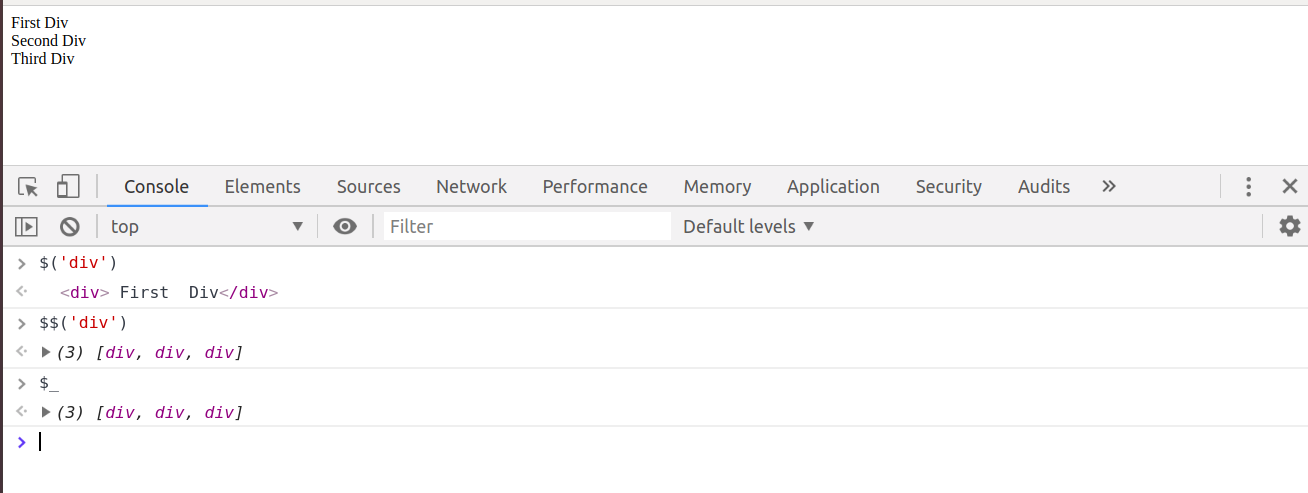
Chrome Dev Console provides shorthand notations for CSS query selectors. They become very useful dealing with DOM elements. Often used with method chaining to operate on DOM elements, some of the useful notations are as follows:
$: document.querySelector(): Returns the first matching element
$: document.querySelectorAll(): Returns all the matching elements
$_: Returns the result of last evaluated expression in the console
Conditional & Inline Breakpoint
Conditional breakpoints are the breakpoints that pauses execution only if a condition evaluates to true. It helps to avoid unwanted pauses during control flow and narrows down conditional logic.
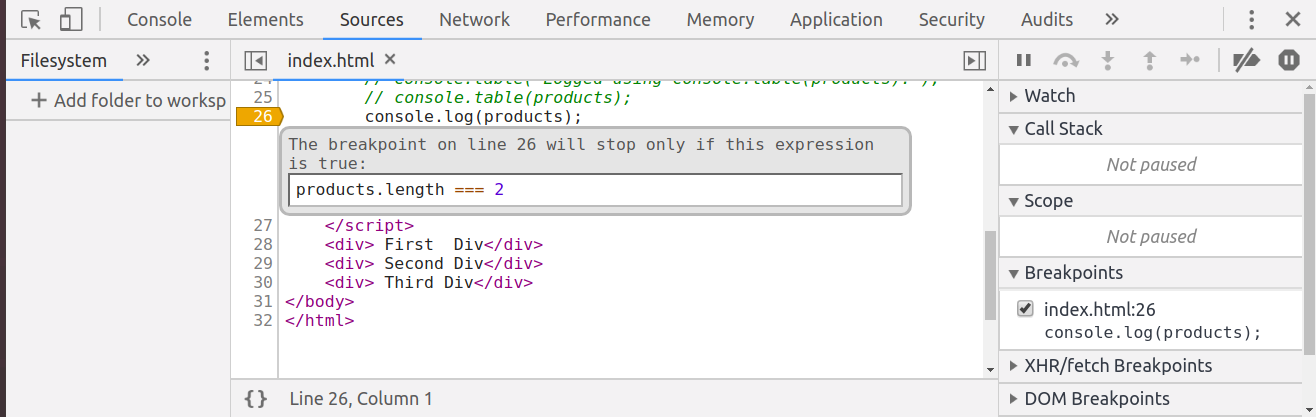
Add Inline breakpoints for pausing and stepping through the entire line of code.
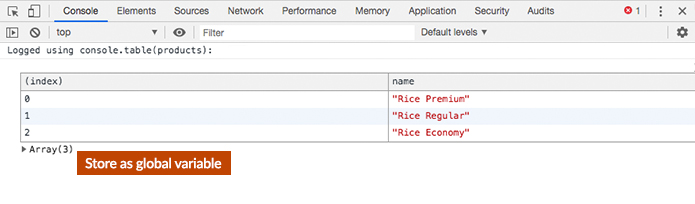
Store as Global Variable
Developers often need to have a proper dataset to play around certain pieces of code while debugging. Chrome’s ‘Store as global variable’ feature comes in handy. It creates a global variable from any variable and makes it available for action in console.
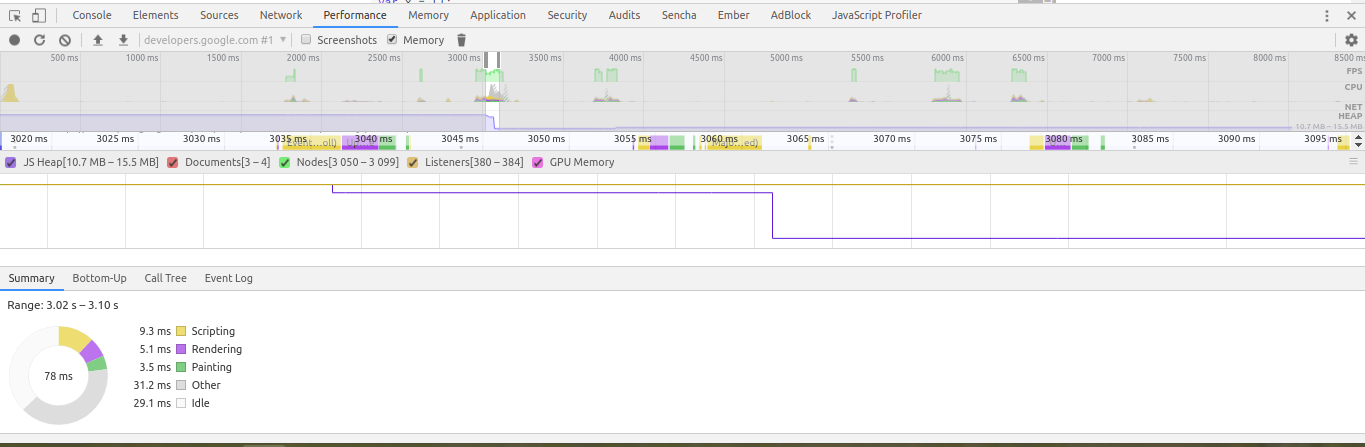
Memory Leak and Its Detection Using Chrome DevTools
JavaScript automatically allocates memory when objects are created and returns them back to the memory pool when they are not being actively used. Due to various reasons and circumstances, sometimes, allocated memory is not retuned back to memory pool even if not in use. This event is referred to as memory leak. Allocated memory remains occupied as long as application is alive. It causes the page to progressively use more and more memory.
Garbage collectors are a bunch of algorithms whose job is to clean unused memory periodically and release them back to memory pool for future use. JavaScript employs garbage collectors to find out memory that is no longer in use by the program. Algorithms are effective most of the time, but memory leak still happens due to wrong coding practice by developers.
How to Avoid Memory Leaks?
Some introduction is required for this section.
- Avoid using global variable. Global variables are not collected and released by garbage collectors. If the global variable content increases in size, it becomes a source of leak. Never forget to reset global variables to null after their use.
- Unreachable DOM Nodes are a major source of memory leaks. Although they are detached from DOM tree, they remain in memory and unnecessarily occupy memory as long as application is alive. Having reference to any node in the tree will prevent the entire tree from garbage collection.
- Closures are another potential source of memory leak. A memory leak occurs in a closure, if a variable declared in outer function becomes automatically available to the nested inner function and continues to reside in memory even if it is not being used or referenced in the nested function.
A more detailed explanation can be found here.
Experimental Features
Want to test the upcoming features in Chrome? One can do so by going to chrome://flags and make sure that Developer Tools experiments flag is turned on. Once it is enabled, one can go to Settings in devtools. There one will find the “experiments” tab. If some of the features that I show here are not available in devtools, one needs to enable that feature in the experiments tab.
This is not an exhaustive list of capabilities of Chrome but these are some of the most frequently used features for debugging and logging purposes. I will continue to explore other features related to application performance and security aspects of chrome in my next outing.
References
- https://developers.google.com/web/tools/chrome-devtools/
- https://developers.google.com/web/tools/chrome-devtools/memory-problems/
About Innominds
Innominds is a leading Digital Transformation and Product Engineering company headquartered in San Jose, CA. It offers co-creation services to enterprises for building solutions utilizing digital technologies focused on Devices, Apps, and Analytics. Innominds builds better outcomes securely for its clients through reliable advanced technologies like IoT, Blockchain, Big Data, Artificial Intelligence, DevOps and Enterprise Mobility among others. From idea to commercialization, we strive to build convergent solutions that help our clients grow their business and realize their market vision.
To know more about our offerings, please write to marketing@innominds.com