What is D3JS?
D3 stands for Data-Driven Documents and allows you to bind arbitrary data to a Document Object Model (DOM), and then apply data-driven transformations to the document. And D3JS is a JavaScript library for manipulating documents based on data.
Traditionally speaking, developers would process the data and draw the visualization, but with D3JS the data is bound to DOM element so that they can dynamically modify, generate or delete as the data changes. Hence, performance is enhanced, avoiding redundant calculations.
Why Use D3JS?
Here are a few good reasons to use D3JS.
- It’s very customizable
- It is easy to use
- It is fast performing
- Need more reasons? Click here! http://christopheviau.com/d3list/
Selections
Like Jquery, D3 also helps to select DOM elements. Examples include:
- Single element
d3.select(“div#main”).html(“Wow D3!”);
Here we select one element that is a div having id=“main” and we can chain the action as we are changing the inner HTML of div here
- Multiple elements
d3.selectAll(“p”).attr(“class”,”text_col_red”);
Here we select all the p element and apply a class to all
- Iteration
d3.selectAll(“p”).each(function(d,i){d3.select(this).text(i);})
Here we select all the p tag from DOM and iterate through each and append current index i.e 1,2,3 as many number of p tags are present in the DOM

Data
We can bind data to DOM element like this:
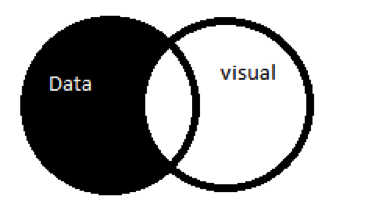
Enter:
- When new data arrives
- When data that has not yet been rendered into visualization
- Enter method selects all such data points and you can use them for rendering
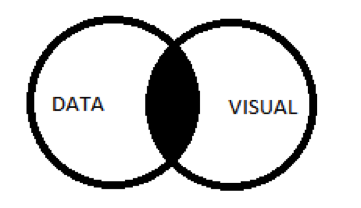
 Update
- When the value is updated (data that has already been rendered)
- Update method selects all such elements that are updated and you can use them to remove from screen
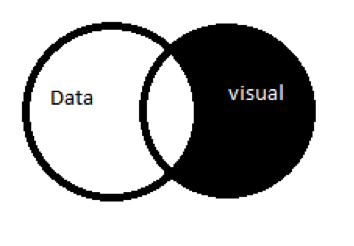
 Exit:
Exit:
- When a visual point already plotted on screen is deleted from dataset
- Exit selects all such elements, you can use it to remove the element
So based on Enter-Update-Exit selection displayed above, you can perform actions like this:
//data as json array
Var data = [{percent:10,val:2},{percent:20,val:3},{percent:30,val:4}];
//on data enter
D3.select(“body”).selectAll(“progress”)
.data(data)
.enter().append(“div”)
.attr(“class”,”progress”);
//when data is removed from array
D3.select(“body”).selectAll(“progress”)
.data(data)
.exit().remove();
//when data value is updated
D3.select(“body”).selectAll(“progress”)
.data(data)
.html(function(d,i){return “index=”+i})
.style(“width”,function(d,i){return d.percent + “%”});
Scales
D3JS deals with two domains:
- Data Domain
- This is the dataset you want to visualize. Eg: CSV, JSON array etc.
- Eg: 3 points (x,y) =(2,3),(5,5),(10,4) the domain range from (2,0) to (0,5)
- Visual Domain
- This is the set containing all the element’s attributes in visual co-ordinate of screen
- Eg: 3 points (x,y) =(200px,300px),(500px,500px),(100px,400px) the domain range from (200px,0px) to (0px,500px)
Scales are functions that map values between data domain and visual domain.
Eg: If you want to draw a bar chart of expense vs time, suppose you spent:
- $1000 in first week.
- $2000 in second week
- $3000 in third week
You will need to map $1000 $2000 $3000 relative to each other into bars to fit the screen
Money spent => height of bar
$1000 => 200px
$2000 => 400px
$3000 => 600px
In such situation you can use scales and scales invert method to map the values.
Var x = D3.scale.linear()
.domain([0,10]) //domain min and max value
.range(10,30)//range min max values
So in above example, our data values range from 0 to 10 and visual range varies from 10 to 30, so we can think of function f(x) = x*a+b; so our function can be f(10) = 10*2+10;
When you want to manipulate data into corresponding visual coordinates, use this scale function like:
Var line = d3.svg.line()
.x(function(d){return x(d);})
.y(function(d){return y(d);})
Here we take the d (data) and send it to scale, which converts the data into visual co-ordinate and give it as x,y attribute to draw line.
Similarly, if you want to convert the visual co-ordinate into data co-ordinate, like $2000 to 400px, you can use x.invert($2000) which will give you the data domain value (x is returned from d3.scale function).
It is flexible. By changing the scale domain and range, all your visualization will realign to new scale if redrawn again. This is very helpful when you have real-time changing data from an API, as you can determine minimum and maximum of domain and range from the new result of API, passing it d3 scale.
Similar to line, we have following types of scales:
- Quantitative: For countable domains
- Linear: A linear funcation scale
- Pow: A power scale,
- Log: A logarithmic scale
- Ordinal: For non qunatative values that are not countable, like color names, week days etc.
- Timing: Can take input domain values as Date so that you can easily plot against time.
Axes:
Axis are important for any chart. D3 axis is an easy way to draw axes on a chart.
Var axis = d3.svg.axis()
.scale(x) // x is scale we formed in above scale section
.orient(“bottom”) //orientation can be top,bottom,left,right
.ticks(5)// number of ticks to be shown on axis
Svg.append(“g”)
.atttr(“class”,”x-axis”)
.attr(“transform”,function(){
Return “translate(”+ margin+”,”+height-margin+”)”;
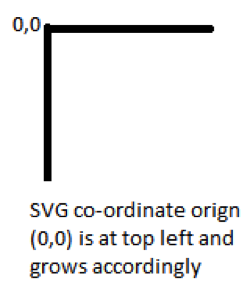
}) // we move the axis slightly from border by margin px on x; and as it should bottom are translating it by height because top left of svg is (0,0) we need axis at (5,height-5)
.call(axis) //call the axis function we create above this will draw the axis and append it to g element appended to svg
Drawing grid using axis
D3.selectAll(“g.x-axis g.tick”) // select all the ticks of x axis
.append(“line”) //append line for each tick
.attr(“x1”,0)
.attr(“y1”,0)
.attr(“x2”,0)
.attr(“y2”,height – (marginTop + marginBottom));
We are drawing a line for each tick from point (x1,y1) = (0,0) to (x2,y2)=(0,height)
On each tick on x axis we draw a vertical line as x1,y1 is already translated x tick position we give 0,0 and x2 =0 as we draw a straight line and y2 = height – twice margin for top and bottom margin.
Similar lines can be drawn on y axis thus forming the grid.
Animation
The key to adding animation in D3 is simple – just add the following lines:
InitialState
.transition()
.duration(duration)
FinalState
Eg: We can add animation while a new visual element is created
D3.select(“body”).selectAll(“progress”)
.exit()
.transition()
.duration(1200)
.style(“left”,”200px”)
.remove();
Before exit of visual element, we move the element to the extreme left (200px) and then remove it. This is done in 1200ms, which feels like animating.
In addition to this normal animation, you can also add more transitions like linear, cubic, sin, bounce, etc This is added using:
.transition().ease(transitionType).duration(1200)
Shapes
Svg.append(“line”)
.attr(“x1”,0)
.attr(“y1”,0)
.attr(“x2”,100)
.attr(“y2”,100)
Similar to line we have
circle with cx (center x position),cy (center y position),r (radius)
rect with x,y,width,height,rx
polygon with points as attribute
path which can be used to draw any shape area arc
You can use interpolation on how a line between two lines could be like
Svg.append(“line”)
.interpolation(“linear”) // values can be cardinal, basis, monotone etc
.attr(“x1”,0)
.attr(“y1”,0)
.attr(“x2”,100)
.attr(“y2”,100)
While using cardinal interpolation we can set tension of line which varies from 0 to 1
Events
Similar to Jquery, D3 uses on function to register events.
svgSelection.on(“mousemove”,function(){
var position = d3.mouse(); //[x,y] position of current mouse location
hoverDiv.setPosition(position); //function to set hover div position based on mouse pointer location
});
The same can be done for other mouse events like: click, cbclick, mousedown, mouseenter,mouseleave,mouseout,mouseover,mouseup.
Zoom and Pan
Var zoom = d3.behavior.zoom() //creates event listener to zoom and pan touch and mouse events
.scaleExtent([1,10]) //decide how much zoom is allowed 1x to 10x here
.on(“zoom”,zoomCallback); // on zoom or pan call this function
Function zoomCallback(){
//here we simply translate the svg selection
//d3.event has current scale and translate vector we just need to apply them
svgSelection.attr(“transform”,function(d){
return “translate(”+d3.event.translate+”)” + “scale(”+d3.event.scale+”)”;
});
}
//calling zoom
SvgSelection.call(zoom);
Drag:
Var drag = d3.behavior.drag() //create drag low level events events
.on(“drag”,moveCallback);
Function moveCallback(){
D3.select(this).transform(function(){
Var pos = D3.event;
Return “translate(”+pos.x+”,”+pos.y+”)”;
})
}
Final Thoughts
We believe D3JS to be an amazingly easy-to-use library for visualization. Having a vast set of examples available for reference, it is very flexible and highly customizable for molding the way you need it to.
Feel free to contact us at Innominds to learn more.
References:
- http://vis.stanford.edu/files/2011-D3-InfoVis.pdf
- Data Visualization with D3.js Cookbook By Nick Qi Zhu