In today’s world of Big Data, we aren’t necessarily in need of more information, so much as needing more relevant and useful information. Enter data visualization.
Data visualization involves the creation of the visual representation of data, with the primary goal of communicating information clearly and efficiently via statistical graphics, plots and information graphics. Effective data visualization helps users analyze and reason about data. Bluntly speaking, it makes complex data more accessible, understandable and usable.
We all know that business users consider data very valuable, given the scope of decisions they have to make everyday that impact their business and stakeholders. Data visualization provides the right information to these users from various sources of connected Big Data to quickly understand and use. As long as the magnitude of data is easily readable and makes sense, it serves the purpose.
Some major factors that data visualization impacts within a company for making quick or appropriate decisions are:
- Market trends
- Competition
- Dynamics in the market
- Customer’s insights
- Customer behavior
It is very important to have the right technology firing out all reasonable and wanted data on to a screen, something that is helpful, understandable and usable by business users whether they be in IT, Finance, Marketing or Executives. A complete intelligent integration of data from various sources helps companies make sense of the data in an easy manner. There are quite a few tools available in the market that can serve the purpose. But choosing the right one will have an impact on whether the purpose is served or not.
This is where Innominds can help. We help companies choose, install and integrate the right tool. We have the expertise and experienced people who have been integrating various sources of data for this very purpose. Innominds also has a fully integrated out-of-the-box solution called iFusion, reduces your time, efforts and costs from days to just minutes.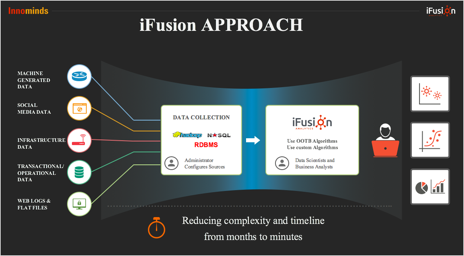
Want to see a demo of iFusion or talk to us about what approach is right for your business needs? Contact us today; we’d be happy to assist.